


The Road To Tech Debt Is Paved With Good Intentions
Table of Contents:
I was on the Salesforce developer podcast talking about speed versus quality a few weeks ago, and I’d encourage you to give that conversation a listen if you haven’t already because it sets the stage nicely for this article. The theory that baking quality in from the get-go begets speed was the basic premise, but I’ve seen the opposite of that play out over and over again in software engineering. Somebody — or a team of somebodies — “hacks something together.” They “need to move fast”, so quality is left at the door. Tests are often an after-thought, or are completely omitted. It doesn’t take long for a project implemented with that sort of mindset to fail — though you can throw a lot of money at the problem to stall an outright failure. No, the “failure” that I’m referring to is a much more insidious kind of failure. It’s the slow build times, flapping tests, hidden complexity, and so much more; the inability to iterate because nothing’s documented and everything is hacked together.
It doesn’t have to be like this, yet it so frequently is. Why is that? And what can we do to avoid it? These are increasingly the questions that I’ve found myself asking. To start to try to answer the question, though, I think it’s useful to show how even when we fail (or maybe even especially when we fail?), the quality of our architecture frequently makes or breaks how long it takes to recover from a problem.
Motivation
In A Year In Open Source, I spoke briefly about how much I’d benefitted from the creation of a dedicated logging class for Apex Rollup. If you’re unfamiliar with Apex Rollup, it’s a free open source tool that creates the equivalent of calculated columns in a database for Salesforce. The simpler calculations are the sorts of thing you could imagine as garden-variety SQL GROUP BY statements — sums, counts, that sort of thing. The more complicated operations vary, but all of them operate under the same premise: given a foreign key and a set of rows, aggregate some aspect of those rows (so that that aggregation can be stored “up” on the foreign key relation). Apex Rollup is being used in production by big enterprise companies like Google, Twilio, and Roku, as well as some of the biggest NGOs in the world; but it’s also being used by small non-profits and new startups. I’m dedicated to keeping the code as performant as possible, and the logging class has proven itself time and time again to be helpful in exposing insights into how users are stress-testing my code in novel and unexpected ways!
I find my open source work provides continual motivation for revisiting and refining old bits of code. I think that knowing the worldwide scale at which Apex Rollup (in particular) is being used helps keep me focused on the overall goal of achieving phenomenal performance through excellent quality. Taking pride in the work we do is something I also try to stress continually in mentoring. The hilarious irony of being (frequently) the sole contributor to an open source project is that I also get the chance to mentor past versions of myself — I’m almost always the source of the tech debt I’m fighting against.
Constraints Are Great
I’ve always loved constraints … I love constraints because they’re triggering creativity in an interesting way - Thomas Bangalter of Daft Punk
I had to laugh while listening to this interview on NPR the other morning, because while Thomas was talking about transitioning from techno to classical music composition, his comments on how a fixed palette still gives you an unlimited number of possible combinations matches my feelings on programming exactly, and object-oriented programming is the constraint that I like to talk the most about.
If the logging in my application wasn’t centralized, I’d have a much harder time getting a comprehensive assessment of each user’s implementation and problems, including my own. Sometimes, the issue turns out to be something else entirely, and it’s the log that shows that. I’ve also had the chance to see users bringing their own logging implementations to Apex Rollup using the plugin infrastructure that I’ve designed; in short, it’s been a very rewarding part of the codebase, and having it be the single source of truth (as a constraint) for logging helps tremendously.
Recently, I found a very interesting example of why and how constraints can be both terrible and awesome — and how tech debt affects us all. I’d heard an interesting story from one of my users who had downstream tests they use to validate Apex Rollup: they had tests that would fail when logging was disabled, but enabling the logging feature flag would cause the test to fail for a different reason. This presented a bit of a conundrum — typically we’d use the logs to address any issues that arose while validating new code, but now it seemed like logging itself was modifying the result of the test(s)?
I set out to investigate the issue by seeding an environment with 100k records (or rows, so to speak), such that there were at least 5 “children” records per “parent.” This kind of large data volume is easy to create in an ephemeral testing environment, and would allow me to reproduce the issue locally by stress testing a large number of children records being aggregated across a variety of complicated, configurable rollups. Because Salesforce itself also constrains how large an individual log file can be, I had definitive constraints to work with when judging my success or failure — if a log could be generated without truncation, especially if prior versions of the code were leading to a log truncation, I could use even the existence of a non-truncated log as a proxy for progress on the issue.
VS Code has a plugin, the Apex Log Analyzer which provides rich analysis tools for log files that get generated by the platform. If you’re interested in reading more about using this tool, check out Benchmarking Matters, as well as the highlights from Four Years In Open Source to see the PR where I use this tool to improve logging performance in Nebula Logger!
In conjunction with the logging implementation I already had, I was able to quickly get some insights into some of the key offenders when it came time to log messages:
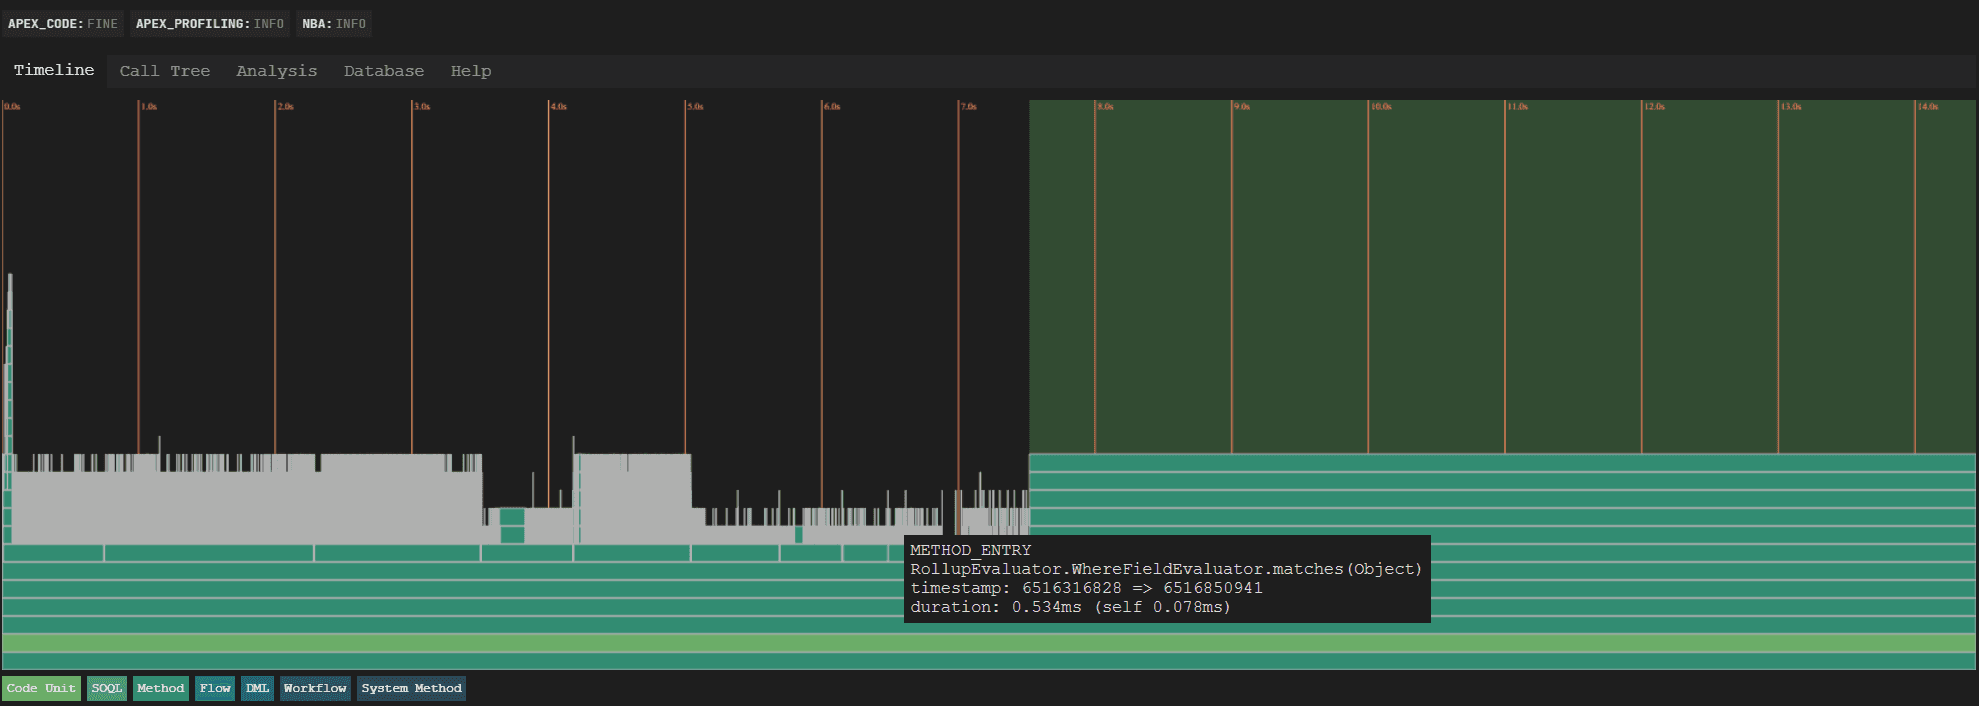
This is cool stuff, but the Timeline view on a log doesn’t always tell the full story in a satisfying way. For surfacing insights, I recommend using the Analysis pane, instead:
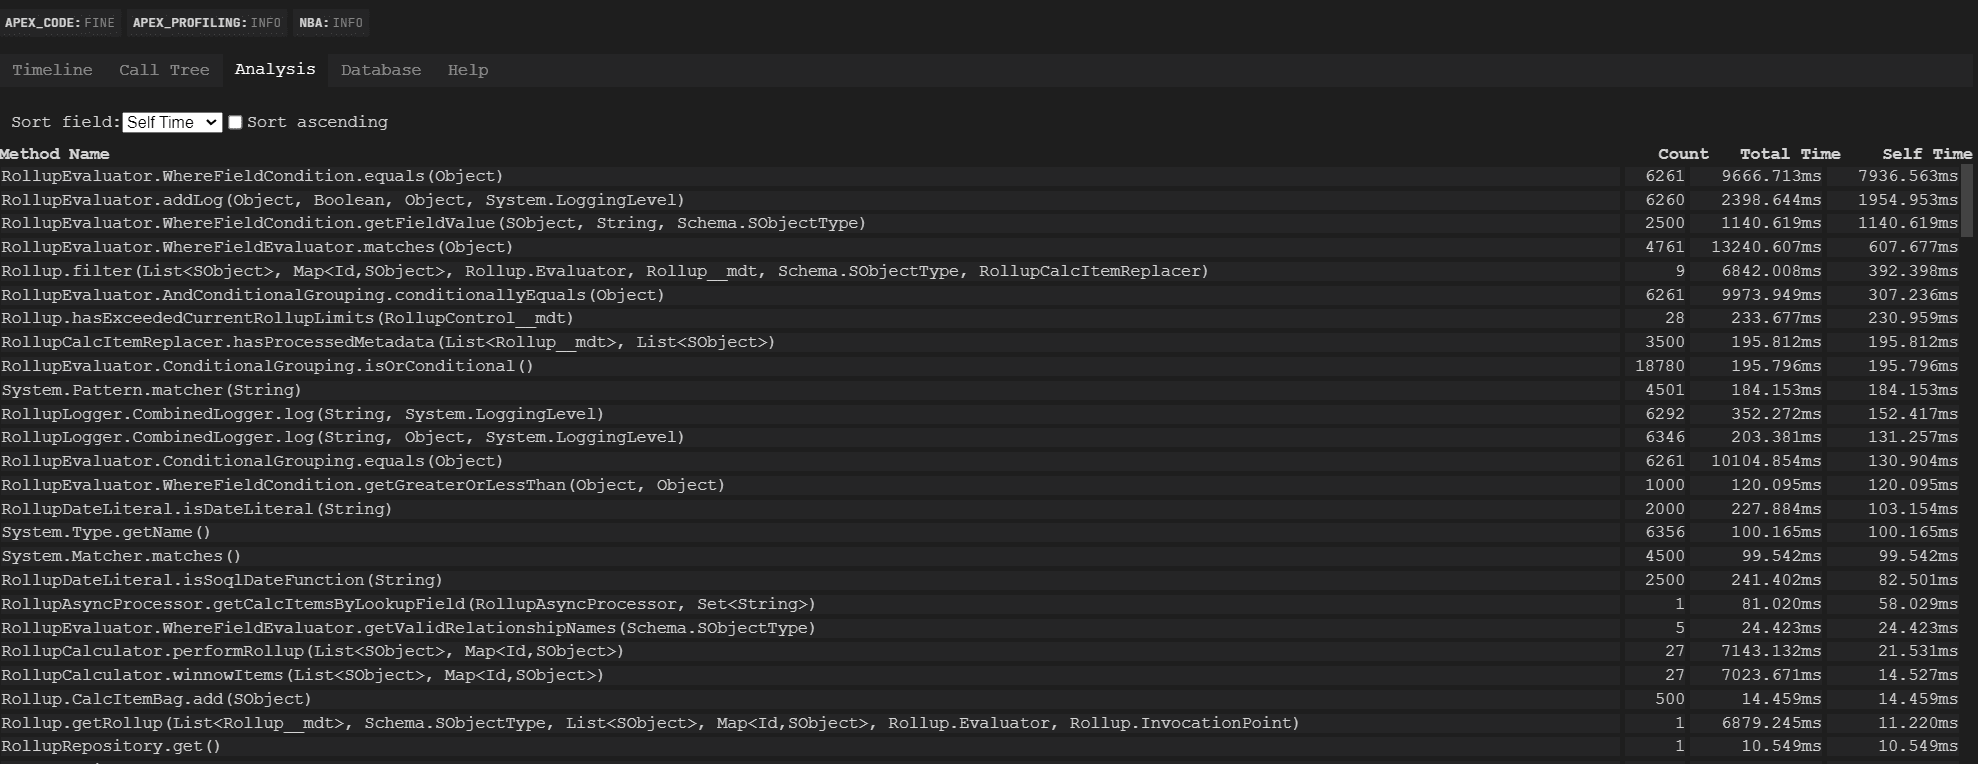
The Count column measures how many times a given method was called. “Total Time” is a bit deceptive and we’ll skip over it; “Self Time” is how long was spent in that given method, and that’s what I’ll be focused on here.
I was able to easily see some low-hanging fruit. It was while looking at this first log that it hit me: the road to tech debt is paved with good intentions. Here are a few of the egregious things that immediately caught my eye:
Rollup.hasProcessedMetadata()being called 3500 times — this was a method that was intended to only be called twice per transaction. I won’t even bother showing the changes for this — it was just a complete oversight on my part!- The class
RollupEvaluatorhad several embarrassing entries; thoughRollupEvaluator.ConditionalGrouping.isOrConditional()wasn’t at the top of the list in terms of time, it was certainly at the top of the list in terms of method call count, and that was completely unnecessary- Most egregious of all was the call to
RollupEvaluator.addLog()— the logging class is feature flagged, which meant that calls to that method should essentially be no-ops
- Most egregious of all was the call to
Something interesting to note — this screenshot and the ones that follow show the top 20 “bad performers” as far as the code is concerned. Absolutely none of the methods shown are related to the core infrastructure within Apex Rollup — the code that actually performs aggregations. I’d had years to refine that code down to a science, and I knew it was performant at extremely large data volume, but the satisfaction I felt with how that code performed clearly had come to overshadow the performance implications of the surrounding architecture.
Getting To The Root Of The Logging Issue
Performance optimization is the ultimate humbler — despite my background in e-commerce, where every millisecond shaved off of response time counts, I’d clearly failed to foresee the side-effects of a few methods which seemed safe to use at the time. Looking at RollupEvaluator.addLog, I saw something very interesting:
private static void addLog(Object clazz, Boolean matches, Object item, LoggingLevel logLevel) {
  RollupLogger.Instance.log(clazz + '\nMatches? ' + matches + ' for: ' + item, logLevel);
}
My original take on the method was: “this is fine since the logging instance returned is feature flagged, and logging is a no-op when the flag is false”

My updated take after looking through the data: “this is a disaster because the first argument’s toString() method is being called even when the feature flag is false, and that can be really computationally expensive!”
The non-optimal solution was a quick fix — stop logging the first argument entirely:
private static void addLog(Object clazz, Boolean matches, Object item, LoggingLevel logLevel) {
  RollupLogger.Instance.log('Evaluator matches? ' + matches, item, logLevel);
}
I purposefully left the now-unused first argument in the method signature because I knew I'd be returning to it soon. I now had a satisfying answer as to the original question posed to me (“why does my test fail for a different reason when logging is enabled?” — because limits were being hit due to each toString() method being called!) but there were quite a few other optimizations to make.
Optimizing Where Clause Evaluation
I remember when I first launched Apex Rollup wondering how long it would be before people asked for the ability to configure which records (which rows) qualified to have their values be rolled up. It took less than a single day 😅! And, for a long time, I knew there were some performance bottlenecks once users were entering clauses to be evaluated at run-time. Some of those clauses it was possible to optimistically delegate to the database layer when performing retrieval, but in-memory evaluation also needs to be supported. For a long time — years, embarrassingly — I assumed that it was the parsing of the entered clauses that was causing CPU time to spike. Once I had generated the above log at scale, though, the actual bottleneck became much clearer - RollupEvaluator.WhereFieldCondition.equals() was burning CPU time like no other.
There wasn’t a single source of the slowness in this method, but with a little investigation, a few key optimizations became clear. One of the biggest wins was a dictionary that was being re-loaded over and over again:
- private Object getFieldValue(SObject item, String fieldPath, Schema.SObjectType sObjectType) {
+ private Object getFieldValue(SObject item, String fieldPath, Map<String, Schema.SObjectField> localFieldNameToTokens) {
  // ...
-   Boolean hasField = sObjectType.getDescribe(SObjectDescribeOptions.DEFERRED).fields.getMap().containsKey(fieldPath);
+   Boolean hasField = localFieldNameToTokens.containsKey(fieldPath);
}
Caching that dictionary at the time of object construction proved extremely helpful.
Measuring Initial Improvements
The first release following this performance deep dive showed a dramatic improvement when looking at the log generated:
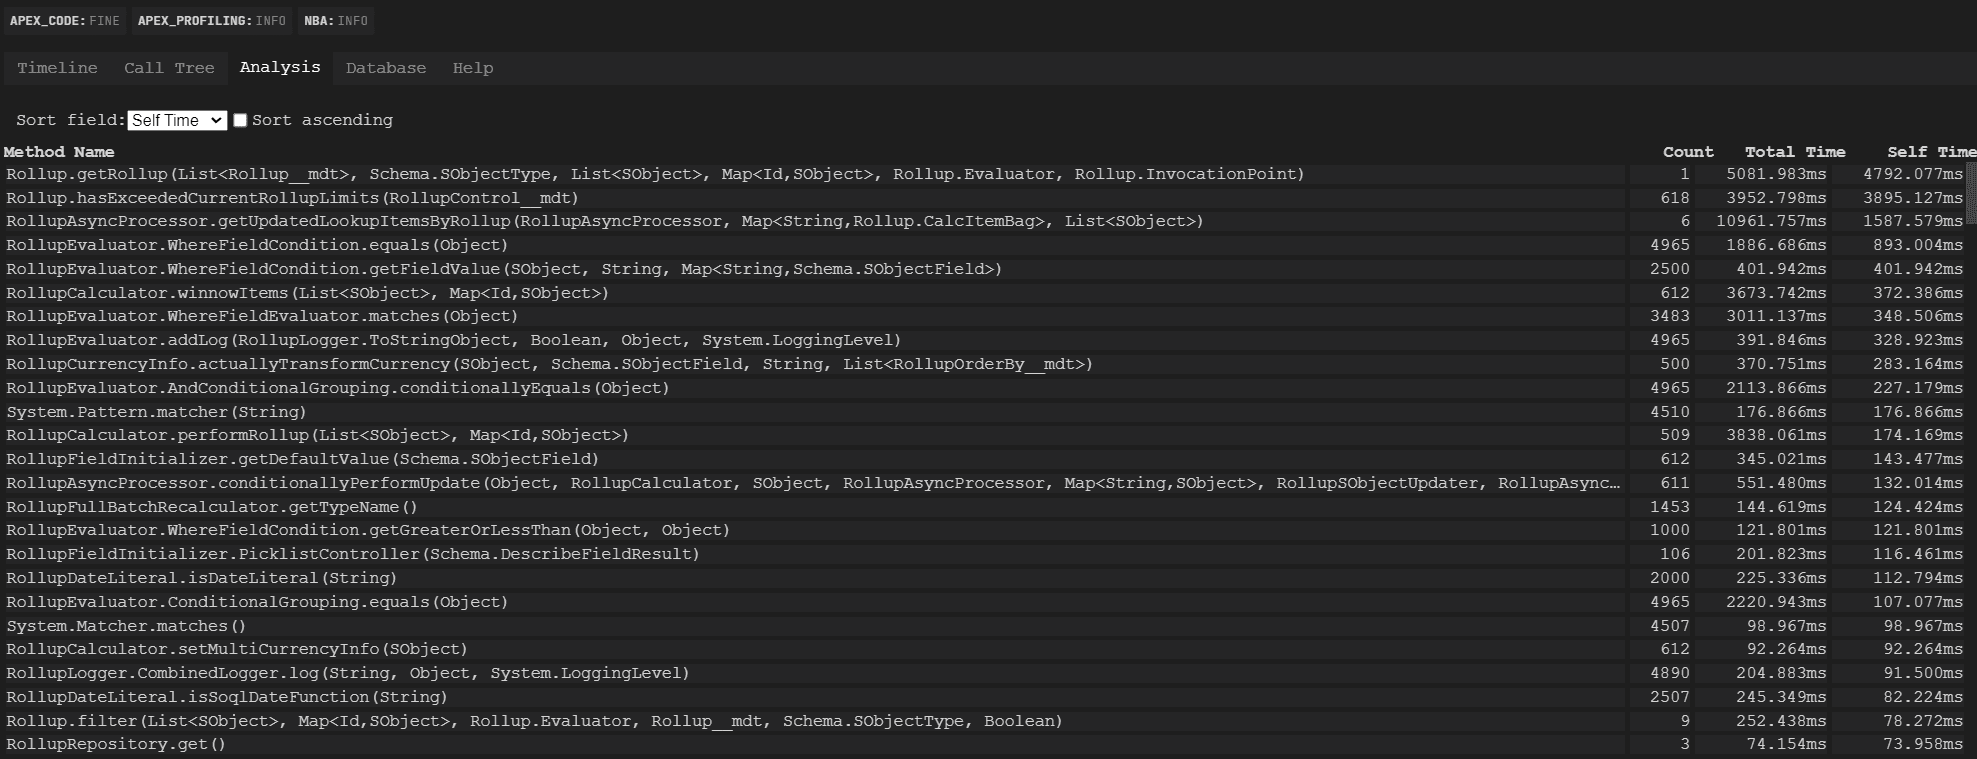
Notice how nearly every major pain point method in the first analyzed screenshot had come down in time cost — sometimes by an order of magnitude! Over the next few releases, I continued to chip away at technical debt on the project by analyzing the logs generated in these runs over the next few releases:
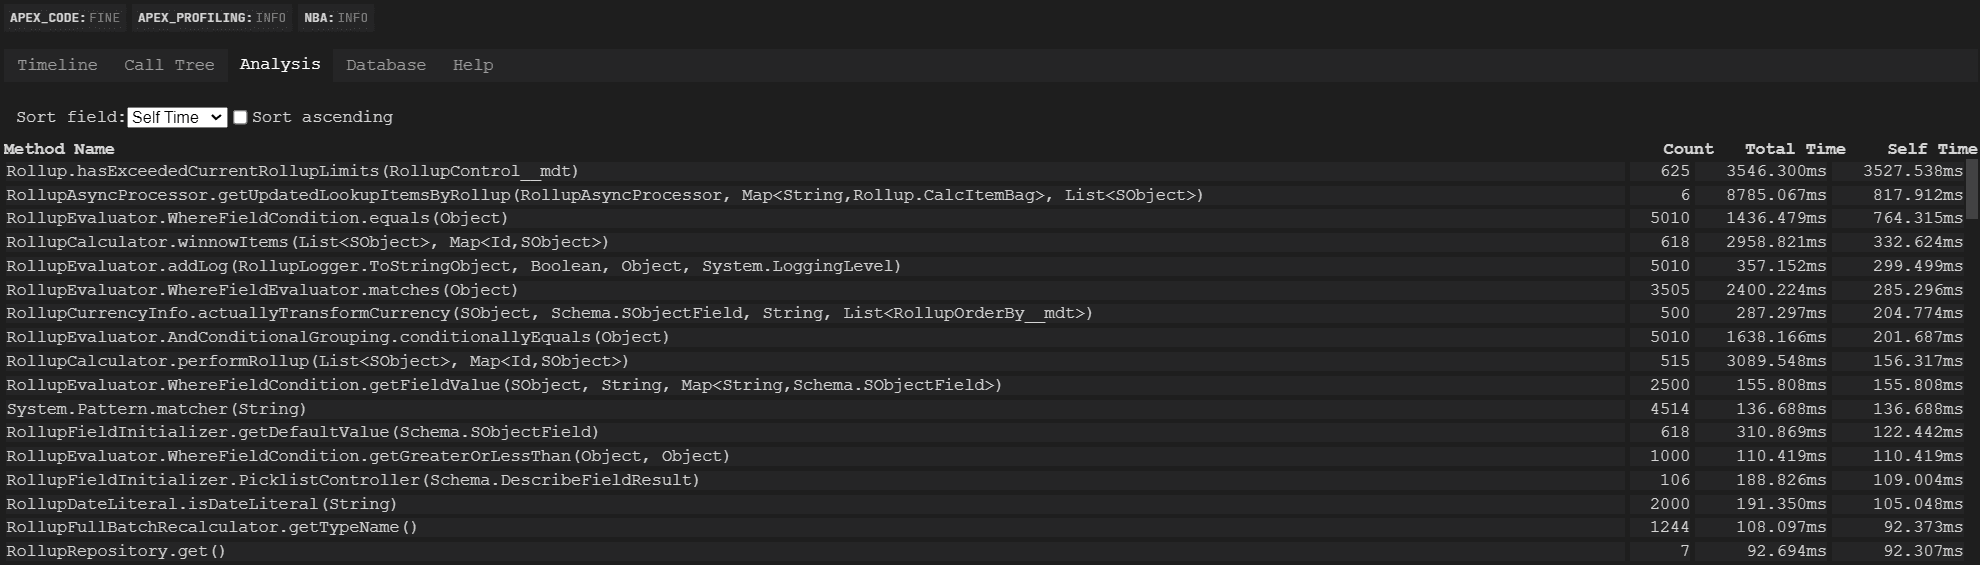
There’s still work to be done — clearly that Rollup.hasExceededCurrentRollupLimits() check is still expensive, but the aggregate time savings has already exceeded 30 seconds per large data volume run. Large data volume calculations are split into different batches, so the time savings is pronounced across two different dimensions:
- how many records are part of each “batch chunk”
- how many records there are total — this determines in conjunction with the above how many batches are necessary to fully recalculate values
Thus if it took 40 seconds to recalculate with batches of 200 records split across 60+ batches due solely to code that really shouldn’t have been run to begin with, a full recalculation like the one I was stress-testing would have taken 45 minutes previously. That same operation can now be done in 5 minutes or less, and I expect to continue to harvest additional time-savings on this front as the year progresses.
But maybe you’re saying something along the lines of: “but how long did it take you to make these improvements, and when will you make up that time??” That’s a perfectly valid question — I probably spoke with my team several times about the work I was doing over the course of the last few weeks, and we as a mob spent a few minutes looking at a few particularly problematic blocks of code together — sometimes retrospectively, as a learning opportunity. Otherwise, I’d say I spent between 2-4 hours on these optimizations — hardly anything out of the ordinary when it comes to my open source schedule! These were some of the quickest wins I’ve ever had the pleasure of experiencing. Again, though I’d accidentally strayed from quality, the overall architecture’s flexibility allowed me to make a number of small changes very quickly that improved performance in a dramatic fashion.
Returning To Logging
I wanted to return to the RollupEvaluator method I’d shown previously to fix it up:
private static void addLog(Object clazz, Boolean matches, Object item, LoggingLevel logLevel) {
  RollupLogger.Instance.log('Evaluator matches? ' + matches, item, logLevel);
}
The issue was two-fold:
- the first argument actually contained crucial information that would help dramatically with debugging any issues (should they arise!)
- the
log()method only deferred evaluation for the second argument
If I wanted to keep performance sacrosanct but still allow for actually useful information to flow through when logging was enabled, I’d need to go further. The basis of the logging method relied on a bit of nasty “polymorphic” code hidden deep in the codebase:
// within RollupLogger
protected String getLogStringFromObject(Object logObject) {
  String appended = '';
  if (logObject == null) {
    return appended;
  } else if (logObject instanceof String) {
    appended = (String) logObject;
  } else if (logObject instanceof List<Rollup>) {
    List<Rollup> rolls = (List<Rollup>) logObject;
    for (Rollup roll : rolls) {
      appended += this.getLogStringFromObject(roll) + '\n';
    }
    appended = appended.removeEnd('\n');
  } else if (logObject instanceof Rollup) {
    appended = logObject.toString();
    // System classes are in the "global" namespace
  } else if (logObject instanceof System.Exception) {
    System.Exception ex = (System.Exception) logObject;
    appended = ex.getMessage() + '\nInner stacktrace: ' + ex.getStackTraceString();
  } else if (logObject != null) {
    appended = JSON.serializePretty(logObject, true);
  }
  return appended;
}
The less that’s said about this particular version of the method, the better. I wanted to make it better and remove the hard-coded references to Rollup — the other stuff is fairly nasty as well, but at least the assumptions being made about log formatting for something like System.Exception help to make the formatting of errors associated with the standard library more legible.
The answer? Marker interfaces! I made an inner interface within RollupLogger, and was able to immediately improve getLogStringFromObject()’s implementation:
global class RollupLogger {
  public interface ToStringObject {
  }

  protected String getLogStringFromObject(Object logObject) {
    String appended = '';
    if (logObject == null) {
      return appended;
    } else if (logObject instanceof String) {
      appended = (String) logObject;
    } else if (logObject instanceof ToStringObject || logObject instanceof List<ToStringObject>) {
      appended = logObject.toString();
    } else if (logObject instanceof System.Exception) {
      System.Exception ex = (System.Exception) logObject;
      appended = ex.getMessage() + '\nInner stacktrace: ' + ex.getStackTraceString();
    } else if (logObject != null) {
      appended = JSON.serializePretty(logObject, true);
    }
    return appended;
  }
}
Because the toString() implementation for lists respects the inner type’s toString(), the recursive call was completely eliminated — and all I needed to append to the Rollup class was:
public class Rollup implements RollupLogger.ToStringObject {
  // etc ...
}
And now, back in RollupEvaluator, I was able to mark each implementation down as also conforming to the interface:
public abstract class RollupEvaluator implements Rollup.Evaluator, RollupLogger.ToStringObject {
  private abstract class ConditionalGrouping implements RollupLogger.ToStringObject {
  }

  private class WhereFieldCondition implements RollupLogger.ToStringObject {
  }

  // there are inner instances of RollupEvaluator that
  // also have toString() customized
  // and since they extend RollupEvaluator they "just work"
  // when it comes to logging

  private static void addLog(RollupLogger.ToStringObject clazz, Boolean matches, Object item, LoggingLevel logLevel) {
    if (matches == false) {
      RollupLogger.Instance.log('Removing non-match for: ' + item, clazz, logLevel);
    }
  }
}
Note that the there was still a performance cost to be weighed — I could have introduced a logging tuple to get around the implicit toString() call to each item. Maybe something like:
public class LoggingTuple implements RollupLogger.ToStringObject {
  public RollupLogger.ToStringObject one;
  // gross, even as an example
  public Object two;

  public override String toString() {
    return one.toString() + '\n' + JSON.serialize(two);
  }
}
At present, I felt the guard clause only triggering logging for non-matches meant it was OK to keep things simple here without allocating anything else. I may change my mind though! If anything, the big lesson in this experiment was that revisiting prior decisions and tweaking them can be a very efficient and prudent thing to do.
Conclusion
When I started measuring performance, I quickly found that the actual bottlenecks in my program had little to do with the actual mission-critical code, and had everything to do with that code’s supporting architecture. I was able to iterate and improve upon that performance quickly over a number of releases, and am looking to automate this sort of large data volume integration testing in a way that makes it easier for me to pinpoint potential issues faster in the future. Whenever I’m automating things, I’m thinking about the classic XKCD on the topic:
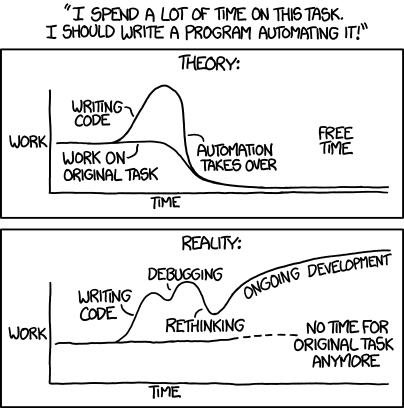
So we’ll see where on the curve I come out ahead on this one (if ever!).
For now, I’d like to thank you for reading and I hope you know — no matter how big or small your application is, no matter how much tech debt there is, there’s always a way to start improving things, even if those improvements start off extremely isolated. My teammates and I spent our last sprint improving one of our legacy applications — it would take a full rewrite to really nail the kind of quality we aspire to, but I’m glad that we were able to make quite a few iterative improvements. That those improvements came at the same time as big wins in my open source work felt really nice. It doesn’t always happen like that, right? Sometimes the best thing we can do is jot down a TODO for later — “this doesn’t work and clearly hasn’t been tested,” or “this works but we don’t know why — come back when we have more time.”
I make mistakes, and I’ll continue to make them. When I wrote the methods in question, they were designed to be extremely performant and scalable. I didn’t intend for them to be part of my own technical debt — but in using them outside of the hyperfocused context in which they were originally developed, they ended up being misused. That being said, I’m glad to now have a really focused lens through which I can objectively measure the performance of my application, and it’s been great to use that framework to judge future enhancements and refactorings. We don’t always get that luxury in our day jobs. To return to the original question — “what can we do to avoid spreading tech debt” — the number one thing I would advocate for is a set amount of allotted time to refactor or improve upon existing code. We have that at work and it’s worked very well so far. There’s no shortage of things to improve upon, but the fact that they’re getting better at all is because of that allotment. I recognize I’m lucky to have the (personal) time to allot towards open source work, and working there to reduce tech debt keeps me excited about taking that savings back to work as well. How do you reduce tech debt — and how do you learn from contributing to it? Let me know!
As always, a big thank you to my supporters on Patreon, and an extra-special shoutout to Henry Vu for his continued friendship and support. If you liked what you read, stick around — there’s a ton of other great content on The Joys Of Apex!
For more on how the best of intentions can create tech debt over time, make sure not to miss out on Custom Metadata Decoupling.